Need to show your data in a flexible way, with cross-tabulation tables, charts, heatmaps and more? Need to be able to export those results to Excel? Need to filter your data and allow your stakeholders play with the results and show the data in the way that suits them in your portals?
We've created WSC Pivot Tables to allow you to create summaries of the data for your stakeholders and let them manipulate that data in real time.
The pivot table will allow you to reorganize and summarize selected questions, choices and rows of data and obtain reports.
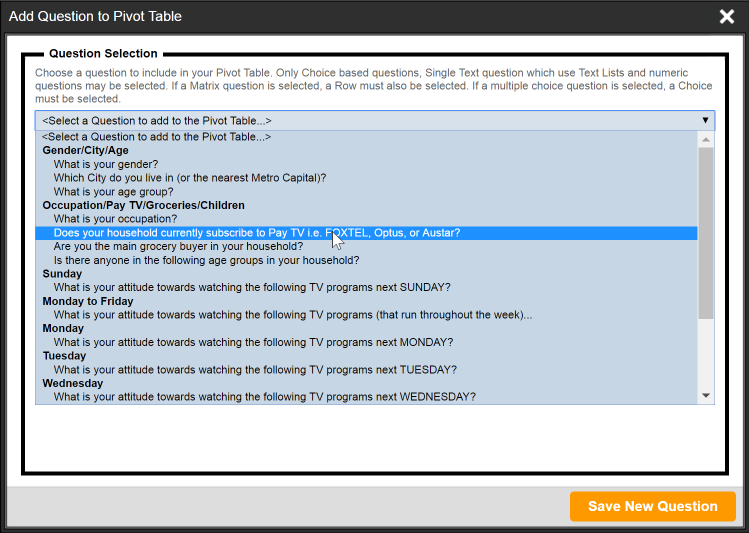
Create a Pivot Table and you can pick from Single and Multiple Selection questions, Matrix and Text Questions that utilise Text Lists. Pick the available questions you want from the interactive dialog and the questions are added to your Pivot Table. Multiple Selection questions (Checkboxes) will need individual Choices selected to allow for the Pivoting process to be relevant.
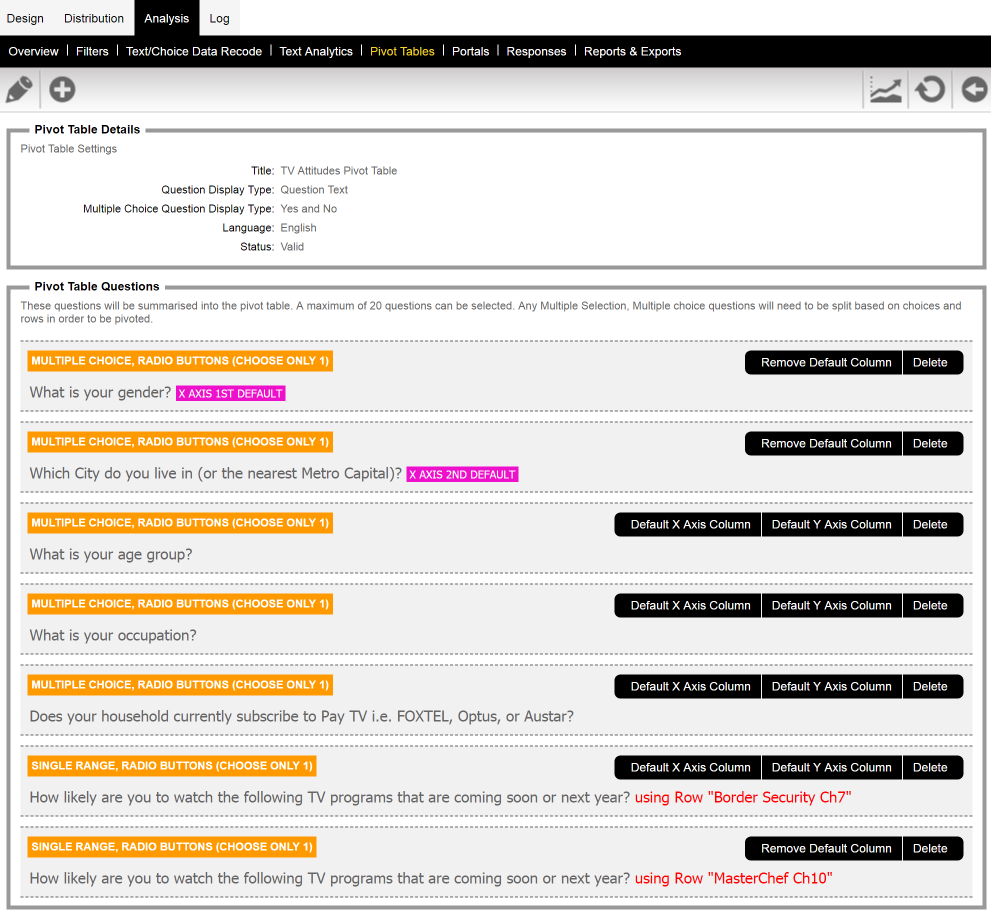
Choose which questions, if any, you want to default on your X and Y Axes. This will be the starting point for your Pivot Table. You can, of course, interact with your Pivot Table in real time and make changes once the Pivot Table is displayed. You can also choose how Multiple Choice, Multiple Selection questions will be treated for individual choices and what text will be displayed when the questions are rendered.
Questions will display the Question Text or the Question Access Code. However, we've also included the ability to use a TAG on the Questions, Rows and Choices. If you use the TAG name of "PIVOTTEXT", its value will automatically replace the displayed text. This allows you to provide short versions of your questions, rows or choices specifically for the Pivot Tables.
When you view your Pivot Table you can "Drag" the questions from each Axis changing the data representation. You can drag questions from the available questions to either of the Axes and from one Axis to the other. The data will automatically recalculate after each change.
You can choose from Tabular versions of your data with the count of selections, statistics, charts and heat maps of the data displayed. Once you have selected the type of display you can adjust the data that is being included.
You can also apply any filter that is available to limit the data that is analysed.
Pivot tables can also be included in Portals providing a way for your stakeholders to create their own ad-hoc views of the results with the ability to save the charts and export the tabular data Excel.
With Portals, only the filters that you have made available to the portal will be available to the pivot table. You can choose to include all pivot tables or only specific tables. The pivot tables will be located on their own menu item on the portal.
The pivot table display on the portal is extended to use 100% of the width of the screen to allow the data to be displayed in the best possible format.
